Gohar F. Khan, PhD
On July 2 2016, Aussies will be going to the ballet box to choose their next premier. In an effort to be chosen, the candidates have launched highly competitive campaigns through a variety of media including social media. At the forefront of this is Twitter where candidates have developed social media campaigns that directly engage with their audiences. While the two leading Aussie candidates are active on Twitter, it is not clear who is comparatively more popular, interactive, or influential. Social media analytics can help us find out. Thus, I analyzed Malcolm Turnbull and Bill Shorten’s Twitter presence to contrast and compare them in terms of interactivity, influence, and popularity.
Interactivity—it is the overall interaction and responsiveness of a Twitter user and can be measured with:
- Re-tweet %: Percentage of re-tweets in the total tweets of a candidate. The higher the percentage the more a user interacts with others.
- Replies %: Percentage of replies in the total tweets of a candidate. The higher the percentage the more a user interacts with others.
- User mentions: the average number of people mentioned per tweet by a candidate. The higher the percentage of mentions the more interaction is happening.
Let us begin our discussion by looking at the interactivity statistics extracted from more than 3,000 tweets per candidate tweeted over the last 4 years (Table 1). The last four years Twitter history graphs (figure 1) shows that both Turnbull and Shorten are consistently active on Twitter averaging more than two tweets per day. This analysis also highlights some seasonable trends, for example, Shorten’s tweets spiked on March 15, 2016 when he appeared in the ABC news channel. It is interesting to note that in terms of interactivity (i.e., re-tweets, replies, user mentions), Turnbull is leading the way. However, when looking at the contents of the re-tweets and the nature of the replies, we found that most of the interactivity is occurs within political circles and not with general public. For example, Turnbull mostly re-tweeted Christopher Pyne (@cpyne) the Minister for Industry, Innovation & Science, the Dept. of Communication, and Senator Cash. And Shorten mostly re-tweeted his own party (@AustralianLabor) and the Labor Herald (@LaborHalard).
Table 1: Candidates Interactivity over Twitter as of June 4, 2016.
| Candidate |
Avg. Tweets/day |
Re-tweets % |
Replies % |
User Mentioned/tweet |
| Turnbull |
2.83 |
21% |
25% |
0.59 |
| Shorten |
2.48 |
19% |
9% |
0.42 |
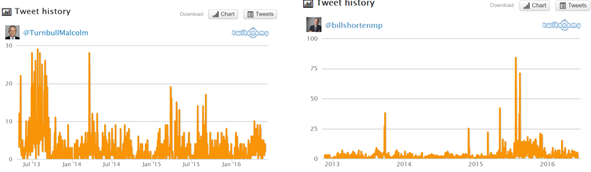
Figure 1: Turnbull’s (left) and Shorten’s (right) Tweet history
Influence—the capacity to have an effect on others which can be measured as:
- Tweets favorited: the proportion of a user’s tweets favorited by others.
- Re-tweets: the proportion of a user’s tweets re-tweeted (or transmitted) by others.
- Mentions: number of times a candidate is mentioned by name. The higher is better.
The influence statistics, however, paint at a different picture (see Table 2 and Figure 2 respectively). Interestingly, Shorten emerged as a more influential social Twitter user. In order to understand the influence statistics, let’s first understand the network figures 2 where nodes represent candidates and their followers and links represents mentions i.e., mentioning a person by name (or the so called Twitter handler). The size of the node is based on in-degree i.e., the number of mentions received by person; the size is bigger when a person receives more mentions. For clarity reasons, only the most influential users are shown. Both the candidates are prominently visible in their networks. Shorten’s network density and clustering co-efficient, however, are higher than Turnbull’s which indicates that Shorten’s network is more cohesive. Close to 70% of Shorten’s tweets were re-tweeted (or transmitted) and 77.78% of his tweets were favorited by his followers which are much higher than Turnbull’s percentages. Based on this, a conclusion can be reached that Shorten is comparatively more influential and his tweets (messages) resonate more with the audience.
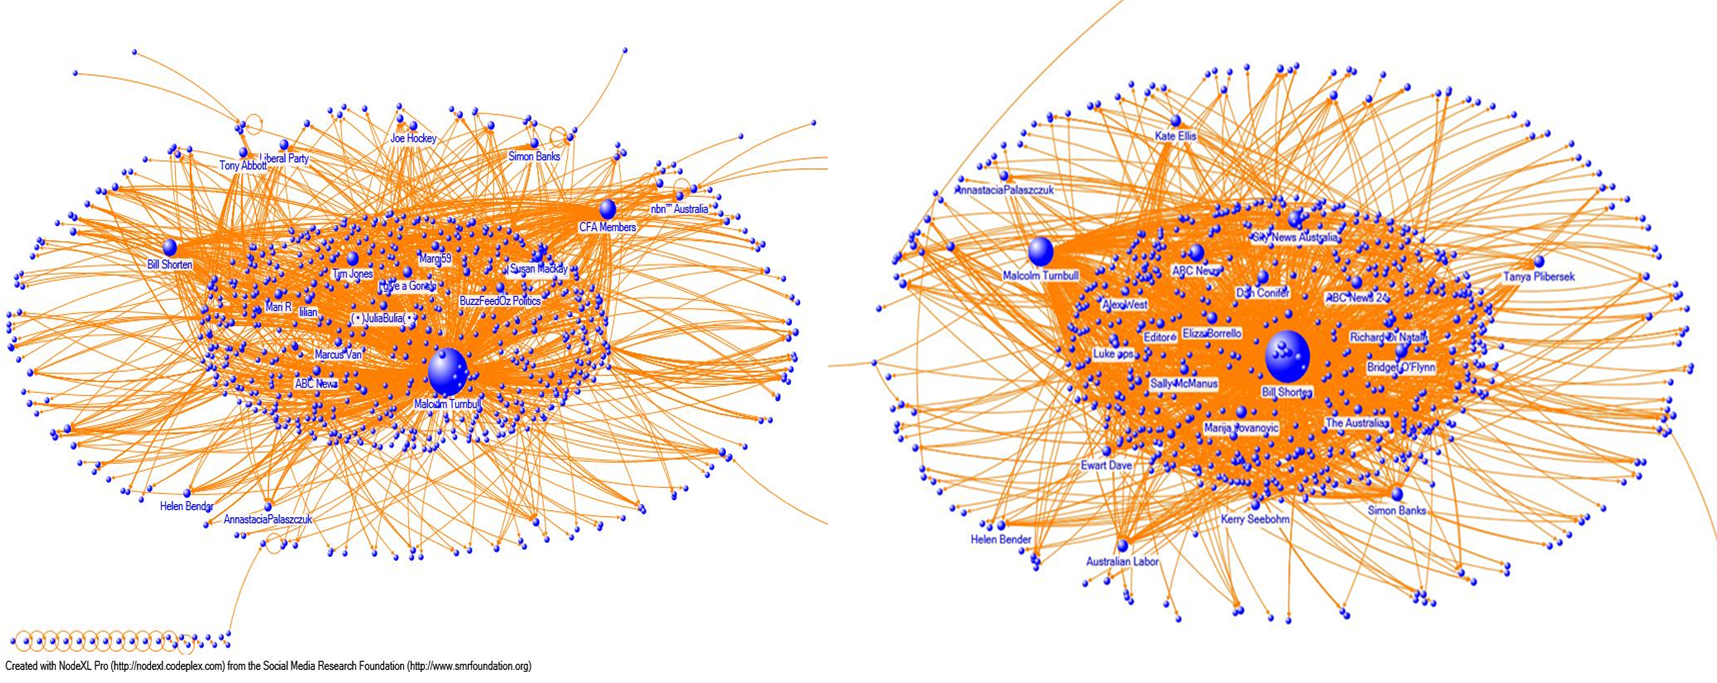
Figure 2: Turnbull’s (left) and Shorten’s (right) Twitter mentions network
One fun thing to note is that Shorten mentioned Turnbull 169 times in his network; more than any other member of his network. While Turnbull mentioned Shorten only 46 times in his network. This may indicate that Shorten is taking a more aggressive stance towards his political counterpart.
Table 2: Candidates’ Influence over Twitter as of June 4, 2016.
| Candidate |
Nodes/links |
Clustering coefficient |
Mentions |
tweets retweeted % |
Tweet Favorited % |
| Turnbull |
675/2,436 |
0.152 |
489 |
62.80% |
64.52% |
| Shorten |
718/2613 |
0.275 |
545 |
79.9% |
77.78% |
Popularity—it is the overall fame of a Twitter user and can be measured with:
- Followers: the number of fans/supporters of a user. The higher is the better.
- Follower/following ratio: it is the ratio of followers per person followed. A ratio more than 1 means a user is more popular.
- Listed: the number of people who added a user to their public list.
And finally, in terms of popularity, with more than 9 thousand followers, 3541 listed, and a follower/following ratio of 137 (i.e., for each person followed by Malcolm receives 173 followers), Turnbull beats Shorten. Shorten had 3,647 followers, 1,244 listed, and follower/following ratio of only 13. A much higher followers/following ratio with a huge number of followers indicates that Turnbull is comparatively more popular than his counterpart.
As an overall conclusion, we can say that over Twitter, Turnbull is more interactive and popular, whereas, Shorten is more influential. However, the real question is whether this type of analysis can be used to predict the future of election outcomes? I will leave this question to future research.


You must be logged in to post a comment.